Show code
library(tidyverse)
library(gt)Scoring Guide and Clinical Interpretation
library(tidyverse)
library(gt)The Myeloproliferative Neoplasm Symptom Assessment Form Total Symptom Score (MPN-SAF TSS), also known as the MPN-10, is a validated patient-reported outcome (PRO) measure used to assess symptom burden in patients with myeloproliferative neoplasms (MPNs).
The instrument was developed and validated by Emanuel et al. (2012) in a prospective international study of 1,408 MPN patients.
The MPN-SAF TSS consists of 10 items, each scored on a 0-10 scale where 0 = absent and 10 = worst imaginable.
items_df <- tibble(
  Item = 1:10,
  Symptom = c(
    "Fatigue",
    "Concentration problems",
    "Early satiety",
    "Inactivity",
    "Night sweats",
    "Itching (pruritus)",
    "Bone pain",
    "Abdominal discomfort",
    "Unintentional weight loss",
    "Fevers"
  ),
  Description = c(
    "Tiredness, weariness, lack of energy",
    "Difficulty focusing or thinking clearly",
    "Feeling full quickly after eating small amounts",
    "Problems with being active or moving around",
    "Excessive sweating during sleep",
    "Skin itching without apparent cause",
    "Pain in bones or joints",
    "Pain or discomfort in the abdomen",
    "Loss of weight without trying",
    "Body temperature above normal"
  ),
  `Common in` = c(
    "All MPNs",
    "All MPNs",
    "MF, PV",
    "MF",
    "MF, PV",
    "PV, MF",
    "MF",
    "MF (splenomegaly)",
    "MF",
    "MF"
  )
)

items_df |>
  gt() |>
  tab_header(
    title = "MPN-SAF TSS Items",
    subtitle = "10-item symptom assessment"
  ) |>
  cols_align(align = "center", columns = Item) |>
  cols_width(
    Item ~ px(60),
    Symptom ~ px(180),
    Description ~ px(280),
    `Common in` ~ px(100)
  ) |>
  tab_style(
    style = cell_fill(color = "#E8F4F8"),
    locations = cells_body(rows = seq(1, 10, 2))
  ) |>
  tab_style(
    style = cell_text(weight = "bold"),
    locations = cells_column_labels()
  ) |>
  tab_footnote(
    footnote = "MF = Myelofibrosis; PV = Polycythemia Vera; ET = Essential Thrombocythemia",
    locations = cells_column_labels(columns = `Common in`)
)| MPN-SAF TSS Items | |||
| 10-item symptom assessment | |||
| Item | Symptom | Description | Common in1 |
|---|---|---|---|
| 1 | Fatigue | Tiredness, weariness, lack of energy | All MPNs |
| 2 | Concentration problems | Difficulty focusing or thinking clearly | All MPNs |
| 3 | Early satiety | Feeling full quickly after eating small amounts | MF, PV |
| 4 | Inactivity | Problems with being active or moving around | MF |
| 5 | Night sweats | Excessive sweating during sleep | MF, PV |
| 6 | Itching (pruritus) | Skin itching without apparent cause | PV, MF |
| 7 | Bone pain | Pain in bones or joints | MF |
| 8 | Abdominal discomfort | Pain or discomfort in the abdomen | MF (splenomegaly) |
| 9 | Unintentional weight loss | Loss of weight without trying | MF |
| 10 | Fevers | Body temperature above normal | MF |
| 1 MF = Myelofibrosis; PV = Polycythemia Vera; ET = Essential Thrombocythemia | |||
The TSS is calculated as the sum of all 10 individual symptom scores.
\[\text{TSS} = \sum_{i=1}^{10} \text{Item}_i\]
Score Range: 0 to 100 (higher = greater symptom burden)
#' Calculate MPN-SAF Total Symptom Score
#'
#' @param fatigue Numeric 0-10
#' @param concentration Numeric 0-10
#' @param early_satiety Numeric 0-10
#' @param inactivity Numeric 0-10
#' @param night_sweats Numeric 0-10
#' @param itching Numeric 0-10
#' @param bone_pain Numeric 0-10
#' @param abdominal_discomfort Numeric 0-10
#' @param weight_loss Numeric 0-10
#' @param fevers Numeric 0-10
#' @return Numeric TSS (0-100)
calculate_tss <- function(fatigue, concentration, early_satiety, inactivity,
                          night_sweats, itching, bone_pain,
                          abdominal_discomfort, weight_loss, fevers) {

  scores <- c(fatigue, concentration, early_satiety, inactivity,
              night_sweats, itching, bone_pain, abdominal_discomfort,
              weight_loss, fevers)

  # Validate inputs
  if (any(scores < 0 | scores > 10, na.rm = TRUE)) {
    warning("Scores should be between 0 and 10")
  }

  sum(scores, na.rm = TRUE)
}

# Example calculation
example_tss <- calculate_tss(
  fatigue = 7,
  concentration = 5,
  early_satiety = 6,
  inactivity = 4,
  night_sweats = 8,
  itching = 3,
  bone_pain = 5,
  abdominal_discomfort = 6,
  weight_loss = 2,
  fevers = 4
)example_df <- tibble(
Symptom = items_df$Symptom,
Score = c(7, 5, 6, 4, 8, 3, 5, 6, 2, 4)
)
example_df |>
gt() |>
tab_header(
title = "Example Patient Scores",
subtitle = glue::glue("Total Symptom Score = {sum(example_df$Score)}")
) |>
cols_align(align = "center", columns = Score) |>
tab_style(
style = cell_text(weight = "bold", color = "#0066CC"),
locations = cells_body(columns = Score)
) |>
grand_summary_rows(
columns = Score,
fns = list(TSS = ~sum(.)),
fmt = ~fmt_number(., decimals = 0)
) |>
tab_style(
style = list(
cell_fill(color = "#FFE4B5"),
cell_text(weight = "bold", size = px(14))
),
locations = cells_grand_summary()
)| Example Patient Scores | ||
| Total Symptom Score = 50 | ||
| Symptom | Score | |
|---|---|---|
| Fatigue | 7 | |
| Concentration problems | 5 | |
| Early satiety | 6 | |
| Inactivity | 4 | |
| Night sweats | 8 | |
| Itching (pruritus) | 3 | |
| Bone pain | 5 | |
| Abdominal discomfort | 6 | |
| Unintentional weight loss | 2 | |
| Fevers | 4 | |
| TSS | — | 50 |
Based on the validation study of 1,408 MPN patients (Emanuel et al., 2012):
norms_df <- tibble(
  `Disease Subtype` = c(
    "Essential Thrombocythemia (ET)",
    "Polycythemia Vera (PV)",
    "Myelofibrosis (MF)",
    "All MPNs Combined"
  ),
  N = c(NA, NA, NA, 1408),
  `Mean TSS` = c(18.7, 21.8, 25.3, 21.2),
  `SD` = c(15.3, 16.3, 17.2, 16.3),
  `Interpretation` = c(
    "Lowest symptom burden",
    "Intermediate",
    "Highest symptom burden",
    "Overall reference"
  )
)

norms_df |>
  gt() |>
  tab_header(
    title = "TSS Reference Values",
    subtitle = "From validation cohort (n = 1,408)"
  ) |>
  fmt_number(columns = c(`Mean TSS`, SD), decimals = 1) |>
  sub_missing(missing_text = "—") |>
  cols_align(align = "center", columns = c(N, `Mean TSS`, SD)) |>
  tab_style(
    style = cell_fill(color = "#D4EDDA"),
    locations = cells_body(rows = 1)
  ) |>
  tab_style(
    style = cell_fill(color = "#FFF3CD"),
    locations = cells_body(rows = 2)
  ) |>
  tab_style(
    style = cell_fill(color = "#F8D7DA"),
    locations = cells_body(rows = 3)
  ) |>
  tab_style(
    style = cell_fill(color = "#E2E3E5"),
    locations = cells_body(rows = 4)
  ) |>
  tab_source_note(
    source_note = "Source: Emanuel et al. J Clin Oncol 2012;30:4098-103"
)| TSS Reference Values | ||||
| From validation cohort (n = 1,408) | ||||
| Disease Subtype | N | Mean TSS | SD | Interpretation |
|---|---|---|---|---|
| Essential Thrombocythemia (ET) | — | 18.7 | 15.3 | Lowest symptom burden |
| Polycythemia Vera (PV) | — | 21.8 | 16.3 | Intermediate |
| Myelofibrosis (MF) | — | 25.3 | 17.2 | Highest symptom burden |
| All MPNs Combined | 1408 | 21.2 | 16.3 | Overall reference |
| Source: Emanuel et al. J Clin Oncol 2012;30:4098-103 | ||||
severity_df <- tibble(
  Category = c("Low", "Moderate", "High", "Very High"),
  `TSS Range` = c("0-10", "11-25", "26-44", "≥45"),
  `Percentile (approx.)` = c("<25th", "25th-50th", "50th-85th", ">85th"),
  `Clinical Implication` = c(
    "Minimal symptoms; monitor",
    "Moderate burden; consider symptom-directed therapy",
    "Significant burden; treatment indicated",
    "Severe burden; urgent intervention needed"
  )
)

severity_df |>
  gt() |>
  tab_header(
    title = "TSS Severity Categories",
    subtitle = "Clinical interpretation guide"
  ) |>
  cols_align(align = "center", columns = c(`TSS Range`, `Percentile (approx.)`)) |>
  tab_style(
    style = list(cell_fill(color = "#28A745"), cell_text(color = "white")),
    locations = cells_body(rows = 1, columns = Category)
  ) |>
  tab_style(
    style = list(cell_fill(color = "#FFC107")),
    locations = cells_body(rows = 2, columns = Category)
  ) |>
  tab_style(
    style = list(cell_fill(color = "#FD7E14"), cell_text(color = "white")),
    locations = cells_body(rows = 3, columns = Category)
  ) |>
  tab_style(
    style = list(cell_fill(color = "#DC3545"), cell_text(color = "white")),
    locations = cells_body(rows = 4, columns = Category)
  ) |>
  tab_footnote(
    footnote = "Categories based on distribution from validation cohort (Mean 21.2, SD 16.3)",
    locations = cells_column_labels(columns = `TSS Range`)
)| TSS Severity Categories | |||
| Clinical interpretation guide | |||
| Category | TSS Range1 | Percentile (approx.) | Clinical Implication |
|---|---|---|---|
| Low | 0-10 | <25th | Minimal symptoms; monitor |
| Moderate | 11-25 | 25th-50th | Moderate burden; consider symptom-directed therapy |
| High | 26-44 | 50th-85th | Significant burden; treatment indicated |
| Very High | ≥45 | >85th | Severe burden; urgent intervention needed |
| 1 Categories based on distribution from validation cohort (Mean 21.2, SD 16.3) | |||
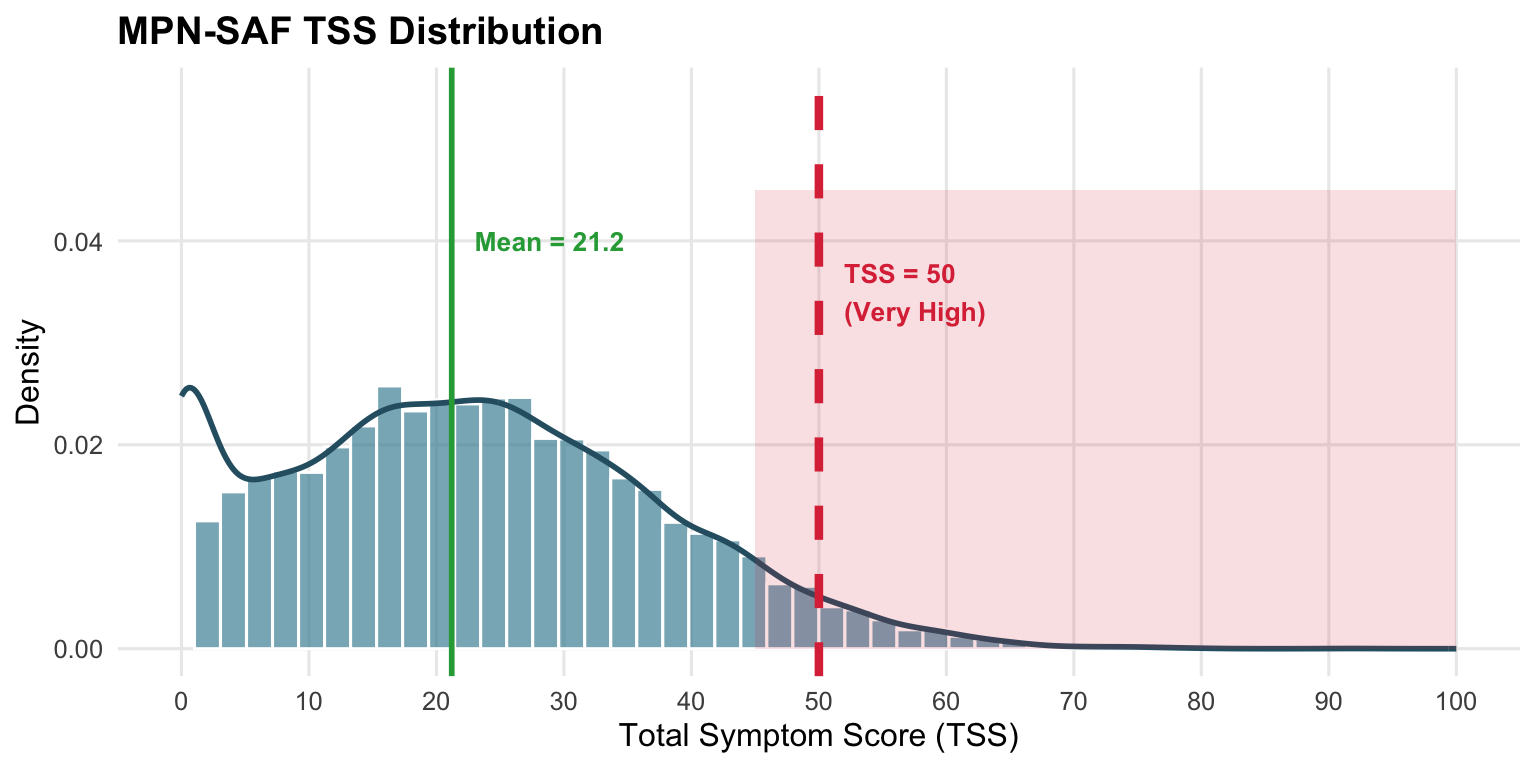
A TSS of 50 represents:
# Simulate distribution based on published parameters
set.seed(42)
tss_dist <- tibble(
  tss = pmax(0, pmin(100, rnorm(10000, mean = 21.2, sd = 16.3)))
)

ggplot(tss_dist, aes(x = tss)) +
  geom_histogram(aes(y = after_stat(density)), bins = 50,
                 fill = "#4A90A4", alpha = 0.7, color = "white") +
  geom_density(linewidth = 1, color = "#2C5F72") +
  geom_vline(xintercept = 50, color = "#DC3545", linewidth = 1.5, linetype = "dashed") +
  geom_vline(xintercept = 21.2, color = "#28A745", linewidth = 1, linetype = "solid") +
  annotate("text", x = 52, y = 0.035, label = "TSS = 50\n(Very High)",
           hjust = 0, color = "#DC3545", fontface = "bold", size = 3.5) +
  annotate("text", x = 23, y = 0.04, label = "Mean = 21.2",
           hjust = 0, color = "#28A745", fontface = "bold", size = 3.5) +
  annotate("rect", xmin = 45, xmax = 100, ymin = 0, ymax = 0.045,
           alpha = 0.15, fill = "#DC3545") +
  scale_x_continuous(breaks = seq(0, 100, 10), limits = c(0, 100)) +
  labs(
    x = "Total Symptom Score (TSS)",
    y = "Density",
    title = "MPN-SAF TSS Distribution"
  ) +
  theme_minimal(base_size = 12) +
  theme(
    plot.title = element_text(face = "bold"),
    panel.grid.minor = element_blank()
  )
In clinical trials, a ≥50% reduction in TSS is commonly used as a meaningful response criterion.
#' Assess TSS Response
#'
#' @param baseline_tss Numeric baseline TSS
#' @param followup_tss Numeric follow-up TSS
#' @return List with percent change and response status
assess_tss_response <- function(baseline_tss, followup_tss) {

  pct_change <- ((followup_tss - baseline_tss) / baseline_tss) * 100

  response <- case_when(
    pct_change <= -50 ~ "Response (≥50% reduction)",
    pct_change < 0 ~ "Improvement (<50% reduction)",
    pct_change == 0 ~ "Stable",
    pct_change > 0 ~ "Worsening"
  )

  list(
    baseline = baseline_tss,
    followup = followup_tss,
    absolute_change = followup_tss - baseline_tss,
    percent_change = round(pct_change, 1),
    response = response
  )
}

# Example: Patient with baseline TSS of 50
example_response <- assess_tss_response(baseline_tss = 50, followup_tss = 22)
Example: A patient with baseline TSS of 50 who improves to TSS of 22:
The MPN-SAF TSS demonstrates strong correlation with quality of life measures:
correlation_df <- tibble(
  Scale = c(
    "Global Quality of Life",
    "Physical Functioning",
    "Role Functioning",
    "Emotional Functioning",
    "Cognitive Functioning",
    "Social Functioning"
  ),
  `Correlation (r)` = c(-0.59, -0.56, -0.56, -0.50, -0.50, -0.48),
  Interpretation = c(
    "Strong negative correlation",
    "Moderate-strong negative",
    "Moderate-strong negative",
    "Moderate negative",
    "Moderate negative",
    "Moderate negative"
  )
)

correlation_df |>
  gt() |>
  tab_header(
    title = "TSS vs. Quality of Life Correlations",
    subtitle = "Higher TSS associated with worse QoL"
  ) |>
  fmt_number(columns = `Correlation (r)`, decimals = 2) |>
  cols_align(align = "center", columns = `Correlation (r)`) |>
  data_color(
    columns = `Correlation (r)`,
    palette = c("#DC3545", "#FFC107", "#28A745"),
    domain = c(-0.6, -0.45)
  ) |>
  tab_footnote(
    footnote = "All correlations p < 0.001",
    locations = cells_column_labels(columns = `Correlation (r)`)
)| TSS vs. Quality of Life Correlations | ||
| Higher TSS associated with worse QoL | ||
| Scale | Correlation (r)1 | Interpretation |
|---|---|---|
| Global Quality of Life | −0.59 | Strong negative correlation |
| Physical Functioning | −0.56 | Moderate-strong negative |
| Role Functioning | −0.56 | Moderate-strong negative |
| Emotional Functioning | −0.50 | Moderate negative |
| Cognitive Functioning | −0.50 | Moderate negative |
| Social Functioning | −0.48 | Moderate negative |
| 1 All correlations p < 0.001 | ||
The MPN-SAF TSS demonstrates excellent psychometric properties:
Emanuel RM, et al. Myeloproliferative neoplasm (MPN) symptom assessment form total symptom score: prospective international assessment of an abbreviated symptom burden scoring system among patients with MPNs. J Clin Oncol. 2012;30(33):4098-103. DOI: 10.1200/JCO.2012.42.3863
Langlais BT, et al. Validation of a Modified Version of the Myeloproliferative Neoplasm Symptom Assessment Form Total Symptom Score. J Hematol. 2021;10(5):207-211. DOI: 10.14740/jh914
Scotch AH, et al. Symptom burden profile in myelofibrosis patients with thrombocytopenia: Lessons and unmet needs. Leuk Res. 2017;63:34-40. DOI: 10.1016/j.leukres.2017.10.002
Document generated: 2026-08-19